Introduction:
Over the last 30 years, the nation's increasing demand for oil and gas production has accounted for the industrial boom of frac sand mining in rural areas of the Midwest, and especially Wisconsin, due to the state's plentiful, high-quality frac sands located at easily accessible positions near to the soil's surface. The up-spring of these sand mining operations have caused political controversies in the communities they reside in, and among the discussion of environmental conflicts that these mine sites pose to their surrounding areas is also growing concern for the damaging economic impact that production transportation has on local roads and infrastructure.
In a case study examining frac sand mining and road repair regulations in nearby Chippewa County, projects that the county's roads will need to increase their overall asphalt thickness significantly, ranging between 0.9 and 6.0 inches, to ensue the road's upkeep for the next decade. A segment of this table from the White Papers is provided in Figure One below:
 |
| Figure One: Required Asphalt Overlay Estimated in Inches over 10 Years |
This table demonstrates the compensation of materials for damages that truck transportation of frac sands has on the Chippewa County road system. The following exercise works to hypothesize an estimated cost that each of Wisconsin's mining counties will face in road reparations as a result of the taxing transport of this increasingly-popular Wisconsin industry. The specific technical objectives of the exercise are listed in the section below.
Objectives:
In completing this exercise, students will demonstrate execution of the following geo-spatial software technical abilities:
- Creating a new script in Pyscripter, setting up the script and its necessary variables
- Writing several SQL statements to select mines based on the following criteria:
- Must be active
- Must not have a rail loading station on site
- Must be at least 1.5 km from a railroad (as an assumption that the mine site did not produce a rail spur to its plant location, and therefore relies on trucks first for the product's transportation.)
- Successfully running all queries
- Practicing with Network Analysis toolbar capabilities, including use of the closest facility solver
- Using Model Builder and a series of tools to ultimately calculate the cost of the industry's truck transportation on roads by county
Methods:
This lab works in two part segments to utilize both python script and Model Builder's expediting processes with Network Analysis routing capabilities to analyze the hypothetical cost impact that the transportation of frac sands to railroad terminals is having on local roads in Wisconsin counties each year.
Part One:
Part One of this exercise uses Pyscripter to perform a series of queries with attributes in the 'mines' feature class and ultimately create a new feature class accounting for all active mines lacking on-site rail loading stations and at a distance of at least 1.5 km from a rail line. These criteria are meant to indicate which mines must rely on trucks to transport the excavated frac sand mines' product. This segment of the project works to satisfy the first three of the five objectives.
The first step required importing the arcpy module to the correct geodatabase and setting up the environments of the geodatabase to a readable and easily editable formula for the remaining length of the script. Variables were set for each of the following feature class layers in the geodatabase:
- "all_mines"
- "active_mines"
- "status_mines"
- "mines_norail"
- "wi"
- "rails_wtm"
- "mines_norail_final"
With the environments built, it was easy to arrange the necessary query statements which would reveal the target mines for the purposes of this project after running the script. The three statements can be seen in the text below, showing the final Python Script that was used to create the final mines feature class, used again in part two of the project.
#-------------------------------------------------------------------------------
# Name: Exercise 7 pt. 1
# Purpose:
# Author: bauerkie
# Created: 10/04/2017
# Copyright: (c) bauerkie 2017
# Licence: <your licence>
#-------------------------------------------------------------------------------
import arcpy
from arcpy import env
arcpy.env.workspace ="Q:\StudentCoursework\CHupy\GEOG.337.001.2175\BAUERKIE\Labs\Exercises\ex7\ex7.gdb"
arcpy.env.overwriteOutput=True
#Set the Variables
all = "all_mines"
active = "active_mines"
Fc1 = "Site_Statu"
norail = "mines_norail"
wi = "wi"
rail = "rails_wtm"
worail = "mines_norail_final"
Fc2 = "Facility_T"
#Set up the field delimiters for the SQL statements
field1 = arcpy.AddFieldDelimiters(Fc1, "Site_Statu")
field2 = arcpy.AddFieldDelimiters(Fc2, "Facility_T")
#SQL statement to select active mines
activeSQLExp = field1 + " = " + "'Active'"
mineSQLExp = field2 + " LIKE " + "'%Mine%'"
norailSQL = "NOT" + field2 + " LIKE " + "'%Rail%'"
#Make a layer from the feature class with mine status = active
arcpy.MakeFeatureLayer_management (all, active, activeSQLExp)
#Make a layer from the feature class with facility type = mines
arcpy.MakeFeatureLayer_management(active, all, mineSQLExp)
#Make a layer from the feature class without rails
arcpy.MakeFeatureLayer_management(all, norail, norailSQL)
#SELECT
arcpy.SelectLayerByLocation_management(norail, "Intersect", wi)
arcpy.SelectLayerByLocation_management (norail, "WITHIN_A_DISTANCE", rail, "1.5 KILOMETER", "REMOVE_FROM_SELECTION")
arcpy.CopyFeatures_management(norail, worail)
print "The script is complete"
The successful execution of this script resulted in the creation of a new feature class hosting a total of 44 mines in its attribute table.
Part Two:
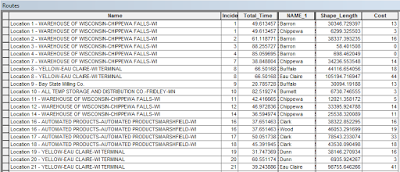
In Part Two, students use the closest facility solver on the network analysis toolbar to locate all the routes that trucks are likely to drive to get from each individual mine to the nearest rail transport. The resulting routes are then pieced out by separate county segments within each route. The "closest facility" solver is the best method for finding likely truck routes to rail terminals, in this case listing the rail terminals layer as the facilities, and the python-executed sand mine layer as the incidences. This will export routes in a stacked method, accounting for each of the trucks driving fragments of the same routes. After solving, a total of 232 routes by county segments appeared most likely to host truck transportation of frac sands. An example of the attribute table is provided in Figure Two.
 |
| Figure Two: Attribute Table of Closest Facilities Route Analysis Solver |
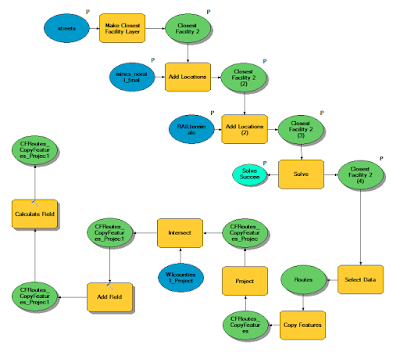
A series of analysis tools and table relationships outlined in ArcToolbox's Model Builder will reveal the estimated cost that this industry's transport has had on local roads and their upkeep by county, per year. The model used to determine each route's estimated costs is displayed next in Figure Three. This figure starts with the execution of the Network Analysis's Closest Facilities Solver explained previously and follows all the way through to the final calculation of a cost field for each route. The calculations used for calculating costs is explained further later on.
 |
| Figure Three: Arriving at Individual Route Costs |
For the purposes of this assignment, an estimate of 50 round-trip truck excursions was used for each of the calculated mine site routes by county. The hypothetical road repair expense was priced at 2.2 cents per truck mile. Since the shape_length field is calculated in feet, the field values can each be divided by 5,280 feet to calculate miles, which was multiplied by 50 roundtrip trucks at a rate of $0.022 per mile. Figure Five shows the layer's attribute table after Model Builder has been run, and the new "Cost" field is generated using the following formula:
"Cost" = "Shape_Length" / 5280 * 50 * 2 * 0.022
Finally, with the results of this additional, calculated "costs" field in the sand mine routes attribute table, the summary table of counties based on the sum of the costs of each route segment can be generated to reveal a table charting each mining county's total road repair costs per year. This table can be found in Figure Six of the next section: "Results."
Results:
The results of each of the calculated sand mines and their corresponding calculated truck routes to the nearest rail terminal (outlined in parts one and two of the methods section) are displayed in the map labeled Figure Five below. The map reveals that most truck routes occur in clusters, indicating that many of the same roads are being utilized for transport, and likely, many of the same roads are taking the bulk of the county costs in damages. It also reveals that a large amount of mine sites are located in Trempeleau County, and many of them are using short road spans (likely to be local roads or highways) to get their product to their nearest road terminals.
 |
| Figure Five: Map showing calculated routes from each of the mine sites to their closest rail terminal |
Figure Six is the resulting table after summarizing the cost field based on each of the counties hosting segments of the routes used from mine sites to terminals. It reveals that Chippewa County road segments take the largest cost burden at a rate of $610.00 per year as a result of sand mining industry traffic, while road segments in Wood County takes the least at only $2.00. Analyzing this chart can help to reveal which counties can afford to take additional road damages and which may consider diverting to the second next closest rail facilities to alleviate these areas of their road cost burdens.
Conclusion:
The totaling repair cost estimates of roads in each county as a result of truck traffic from frac sand mining was derived in the processes described in this lab. These types of infrastructure impacts are important to consider in assessing the potential hazards that these industries may inflict on road conditions when taking a look at these areas and assessing their ability to take on more of this industry.
Sources:
The White Papers, accessed through:
http://midamericafreight.org/wp-content/uploads/FracSandWhitePaperDRAFT.pdf


No comments:
Post a Comment